
HIPAA Security Risk Assessment: Identifying HIPAA Security Risks
HIPAA Security Risk Assessment: Identify HIPAA security risks and vulnerabilities. Ensure compliance with HIPAA Security Rule.

The Health Insurance Portability and Accountability Act (HIPAA) became law in 1996. HIPAA sets protection standards for patient information. Under HIPAA, covered entities must assess risks to protected health information (PHI). Health and Human Services (HHS) updated their Security Risk Assessment Tool in 2022.
This update included references to the Health Industry Cybersecurity Practices (HICP). The qualitative risk output can be challenging to communicate to business leaders. This blog introduces our new approach to conducting HIPAA security risk assessments. We leveraged the HICP to define potential risk mitigation measures against five threats. To quantify risk, we used the factor analysis of information risk (FAIR) model.
How to Ensure HIPAA Compliance with Security Risk Assessments?
Section 164.308 requires covered entities to have a security management process. The implementation of this standard requires organizations to conduct a risk analysis. This includes assessing risks to the confidentiality, integrity, and availability of PHI.
It also requires reasonable and appropriate security measures to reduce risks. Section 164.306 requires covered entities to protect PHI against anticipated threats. Covered entities may use any security measures that meet the specified standards.
In deciding which security measures to use, covered entities must take into account:
- The size, complexity, and capabilities of the covered entity or business associate
- The technical infrastructure, hardware, and software security capabilities.
- The costs of security measures
- The probability and criticality of potential risks to electronic protected health information
What is Involved in Risk Management for HIPAA?
HIPAA risk management is a continuous process that builds on the findings of a security risk assessment. Once risks to ePHI have been identified, organizations must implement reasonable and appropriate measures to reduce those risks to an acceptable level, as outlined in §164.308(a)(1)(ii)(B).
Effective HIPAA risk management involves:
- Establishing a Risk Management Plan: Organizations must document a strategy for addressing identified risks. This plan should include timelines, responsible parties, and specific mitigation steps.
- Implementing Safeguards: Security controls (administrative, physical, and technical) must align with the risks identified during the assessment. These may include encryption, access controls, security training, and audit logs.
- Monitoring and Reviewing Controls: Risk management is not static. Organizations must periodically evaluate the effectiveness of their safeguards and adapt to emerging threats, system changes, or organizational growth.
- Maintaining Documentation: OCR enforcement actions frequently cite a lack of risk management documentation. Covered entities and business associates must retain records that demonstrate both the analysis and the steps taken to mitigate risks.
- Integrating with Broader Compliance Programs: Risk management should align with other organizational compliance efforts, including business continuity, disaster recovery, and incident response planning.
Risk management under HIPAA is not one-size-fits-all. The chosen controls should reflect the organization’s size, complexity, resources, and technical capabilities. When executed correctly, risk management reduces liability, protects patient data, and strengthens the overall security posture of the organization.
How to Ensure HIPAA Compliance with Security Risk Assessments?
To comply with HIPAA, organizations must conduct a thorough and accurate assessment of risks and vulnerabilities to ePHI, as required by §164.308(a)(1)(ii)(A). This risk analysis forms the foundation of the HIPAA Security Rule's administrative safeguards and guides the implementation of appropriate protections.
Ensuring compliance involves several key steps:
- Define the Scope: Identify where ePHI is created, received, maintained, or transmitted. This includes electronic health record systems, mobile devices, cloud platforms, and backup solutions.
- Identify Threats and Vulnerabilities: Evaluate all potential sources of unauthorized access, data loss, or system failure. These may include external attacks, human error, equipment theft, or natural disasters.
- Assess Likelihood and Impact: Determine how likely each threat is to occur and the potential impact on the confidentiality, integrity, and availability of ePHI.
- Evaluate Current Safeguards: Document existing security controls and assess whether they sufficiently mitigate identified risks.
- Determine Risk Levels: Assign risk ratings based on threat likelihood and potential impact. This helps prioritize which risks require immediate mitigation.
- Document Findings and Remediation Plans: Maintain detailed records of the assessment process, outcomes, and plans for risk mitigation. This documentation is critical in the event of an OCR audit or investigation.
- Review and Update Regularly: Security risk assessments are not one-time events. Organizations must reassess risks whenever there are significant changes to systems, processes, or regulatory requirements.
Incorporating industry guidance, such as the HICP publication and the FAIR model, helps organizations produce more actionable and business-aligned assessments. By quantifying risks and linking them to mitigation strategies, covered entities and business associates can make informed decisions, demonstrate compliance, and strengthen their overall security posture.
Security Risk Assessment (SRA) Tool
HHS has long maintained a free Security Risk Assessment (SRA) Tool. The executable guides the practitioner through a series of question sections. These questions identify the organization's security capabilities. At the end of each section, the practitioner identifies relevant threats.
Practitioners rate their likelihood and impact based on a qualitative scale. The SRA tool does not relate the assessed security posture and threat likelihoods. Presenting qualitative risk makes it difficult to communicate risk to business leaders. The output does not suggest or rank potential mitigating activities.
NIST Risk Assessment Guidance
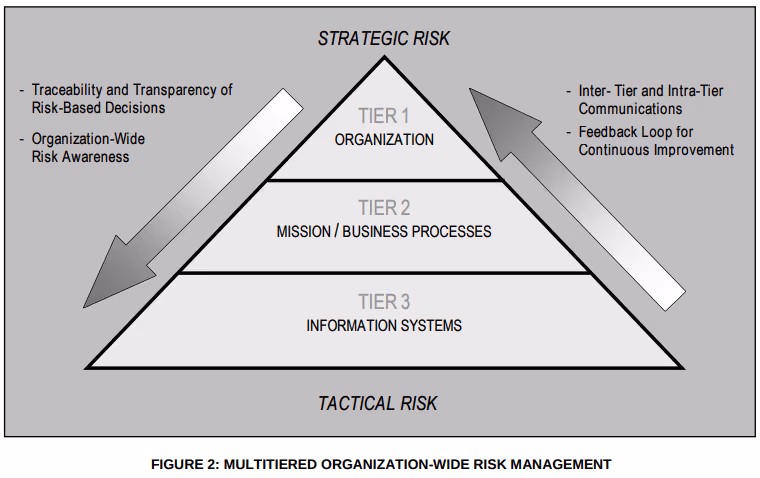
NIST defines risk as a function of the degree of harm and likelihood of harm occurring. A risk assessment should consider threats, vulnerabilities, likelihood and impacts. NIST defines a three tier approach to assessing and managing risk in SP 800-39.
NIST has written several special publications on risk management and assessments. NIST does not specify algorithms for combining risk factors. Rather, they expect communities to define appropriate models that reflect their views.
Using the HICP to Address Cybersecurity Threats
The 405(d) program is a collaborative effort led by HHS. It includes thought leaders from across the Healthcare and Public Health (HPH) sector. The goal is to align healthcare industry security practices. The main publication of 405(d) is the Health Industry Cybersecurity Practices (HICP). HICP provides practices for the HPH sector to mitigate pervasive cybersecurity threats.
The five threats explored in this document include:
- Social engineering
- Ransomware attacks
- Loss or theft of equipment or data
- Insider, accidental or malicious data loss
- Attacks against network connected medical devices that may affect patient safety
There are two supporting technical publications. Technical Volume 1 outlines ten cybersecurity practices for small healthcare organizations. Technical Volume 2 tailors their implementation for medium-sized and large organizations. Both publications map the mitigations of these practices to five threats. HICP falls short of prescribing an algorithmic risk model.
Cyber Risk Quantification Using the FAIR Model
The FAIR Institute published a standard taxonomy and quantitative risk model . FAIR stands for the factor analysis of information risk. FAIR quantifies risk using a loss event frequency and loss magnitude. Loss event frequency is a function of threat event frequency and susceptibility.
Loss magnitude is the sum of primary and secondary losses. Quantifying risk helps express cybersecurity incident impacts in terms business leaders can understand. Risk quantification also helps prioritize mitigating activities.

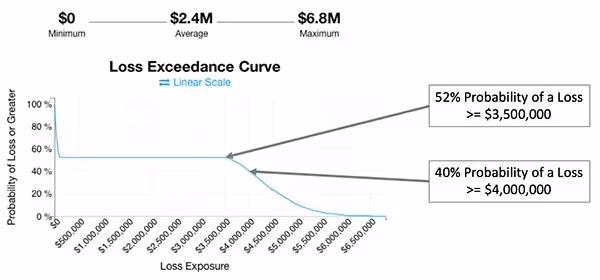
Expressing Risk Using a Loss Exceedance Curve
Risk is often expressed on a heat map using a fixed value. An alternative approach is to calculate an impact range and corresponding probability. A loss exceedance curve is a way to visualize the probability of loss exceeding a certain amount.
The curve plots the probability and impact values of various scenarios. These scenarios often use a Monte Carlo simulator.
How We Built The HIPAA Risk Assessment Resource
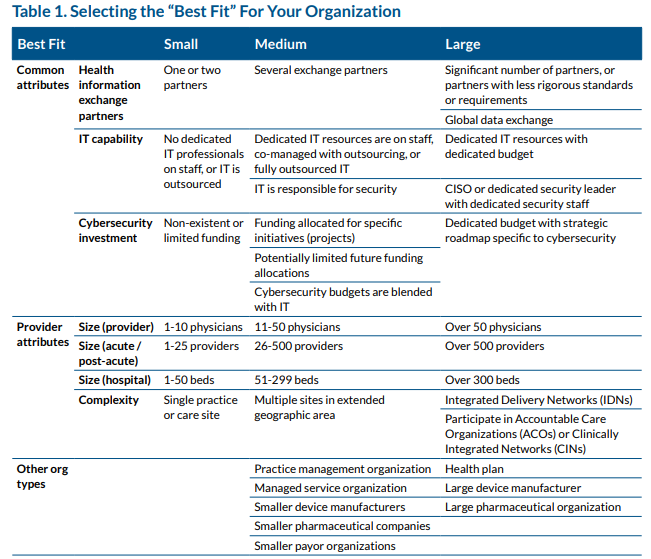
Tailoring HICP Practices
In keeping with the HICP guidance, a practitioner must categorize the organization. The workbook scores input responses based on Table 1 of the HICP Main publication. The workbook provides a recommended categorization (Small, Medium-Sized, or Large Organization).
Selecting the Small Organization category tailors the HICP practices to Technical Volume 1. Selecting the Medium-Sized or Large Organization tailors the HICP to Technical Volume 2. Practice 9 is only relevant when the organization has networked connected medical devices.
Assessing HICP Practices
Small organizations may use the Cyber Pulse Check. The cyber pulse check consists of 55 questions with prepopulated responses. The practitioner selects which response best describes their existing implementation.
Conditional formatting rules highlight healthy and risky responses associated with each practice. The HICP tab lists every sub practice of Technical Volume 1. Sub practices may contain more than one criterion based on the HICP publication.
Medium-sized and large organizations should assess the status of all practices. Each line on the HICP tab includes an input cell to identify a met or not met criterion. The workbook calculates the subpractice status after the practitioner assesses all related criteria.
Quantifying Impacts
The impact tab enables practitioners to define three scenarios for each HICP-addressed threat. We provided prepopulated scenario descriptions but they are adjustable by the practitioner. A low impact scenario entails limited adverse effects on organizational operations or assets. A moderate impact scenario should degrade the organization’s ability to perform functions. A high impact scenario should prevent the organization from performing its primary function.
For each scenario, the workbook suggests costs for the practitioner to consider. These include direct impacts and indirect impacts. The practitioner should document anticipated impact costs for each scenario. A slider at the top of this tab enables the practitioner to assess the confidence level of the estimates. For example, a 90% confidence level suggests a high degree of confidence.
Practitioners define the risk tolerance levels for low, moderate, and high impact scenarios. Much like the impact table, these fields accept a tolerance volume in dollars. Documenting the risk tolerance level helps identify risks that exceed an acceptable threshold.
Loss Event Frequency
The likelihood tab presents the five threats. This screen includes information relative to the mitigating status of corresponding practices. We provided threat event frequencies based on the categorization of the organization. The practitioner may override the threat event frequency using an integer. This number estimates the number of times the organization will face each threat in a given year.
The workbook calculates mitigating strength using the following formula:
Direct mitigations identified in HICP have a score of 2 for each relevant threat. Indirect mitigations have a score of 1 for each relevant threat. The sum of all mitigations for a threat represents the possible mitigation score.
The workbook scores met practices based on this scoring as well. Met direct mitigations receive a score of 2 for each relevant threat. Met indirect mitigations receive a score of 1 for each relevant threat. Partial mitigations receive half the possible score for each.
The resistance strength is the mitigation score divided by the possible mitigation score. Again, the practitioner may override the resistance strength score if they prefer.
Loss event frequency is threat event frequency times the inverse of resistance strength. For example, 10 expected threat events with a resistance strength of 40%, would equal 6 loss events.
Impact Distribution
The likelihood tab also presents three sliders per threat. These allow the practitioner to determine the distribution of potential loss events. Practitioners should consider the status of the corresponding mitigations to estimate this distribution. By default, the distribution is equal across the three potential impact scenarios. Moving the slider to the right, increases the distribution for that impact level.
The confidence slider is also present on the likelihood tab. The slider adjusts the same value defined on the impact tab. Increasing the confidence level reduces the variability used in the Monte Carlo simulation. For example, a 90% confidence allows only a 10% variance among simulations.
Monte Carlo Simulator
The Monte Carlo simulator takes input from the impact and likelihood tabs. For example, the practitioner may estimate 9 loss events from social engineering threats. An even impact distribution would produce three low, moderate, and high impact events. The practitioner estimated $1,000 as the loss for a low impact event with a 90% confidence level. The Monte Carlo simulator will estimate three low impact loss scenarios. The impact of each scenario will remain within 10% of the initial estimate of $1,000. The same calculation repeats for the three moderate and three high impact events.
Monte Carlo simulations calculate the probability of each outcome. Helper tables count the total number of impact events and rank them. The Monte Carlo simulator then assigns a probability to each event.
Loss Exceedance Curves
Output from the Monte Carlo simulator plots the curves on the loss exceedance charts. The X-axis represents the dollar value of potential loss for each scenario. The left side of the curve represents lower impact events. The right side represents higher impact events. The Y-axis represents the probability of each outcome. The top of the chart represents a 100% probability of a loss event occurring. The bottom of the chart represents a 0% probability of a loss event occurring.
The plotted curve identifies the likelihood of a threat producing an impact of a given value. Incorporating risk tolerance identifies the likelihood of a risk exceeding the tolerance threshold.
Risk Register
The risk register identifies the five threats. The register identifies the resistance strength and the estimated range of annual impacts. The final column has a drop-down for five potential risk treatment options:
- Accepting implies that the risk falls below the risk tolerance threshold.
- Rejecting implies the organization plans on eliminating the system exposed to the risk.
- Mitigating implies the organization will lower either the likelihood or impact.
- Sharing implies the organization plans on distributing the risk to other parties.
- Transferring the risk implies the organization plans on taking out an insurance policy.
Below the risk register is a list of mitigating activities assessed as not met. These mitigating activities are subpractices self-assessed as not met. The table ranks mitigations based on the total value across all five threats. The table details the mitigating value of each subpractice associated with each threat. A slider can adjust these values according to low, moderate, and high impact scenarios.
What Are the Consequences of Failing to Conduct a HIPAA Risk Assessment?
Failing to conduct a HIPAA security risk assessment can have serious operational and financial consequences. Without a formal analysis, organizations cannot accurately identify vulnerabilities to electronic protected health information (ePHI). This gap increases the likelihood of security incidents, such as data breaches or ransomware attacks, that disrupt care delivery and compromise patient trust.
Beyond the risk to patients and systems, noncompliance exposes organizations to enforcement actions. The HHS Office for Civil Rights (OCR) has issued substantial financial penalties, ranging from tens of thousands to millions of dollars, for organizations that failed to conduct an adequate risk analysis. These investigations often cite violations of §164.308(a)(1)(ii)(A), which requires a risk analysis as the foundation of the security management process.
Risk assessments are not just a compliance checkbox, they are a proactive strategy to anticipate threats, reduce exposure, and justify cybersecurity investments. Skipping this process leaves organizations unable to demonstrate due diligence and ill-prepared to defend their security posture in the event of an audit or breach.
Conclusion
More than half of healthcare organizations will increase cybersecurity spending this year. Risk assessments enable strategic prioritization of cybersecurity spending. We built this risk calculator to empower security professionals to leverage HICP guidance.
Using the FAIR model, practitioners can communicate their findings to their business leaders. We welcome any feedback from the community on your experience using this resource.
Emphasize your product's unique features or benefits to differentiate it from competitors
In nec dictum adipiscing pharetra enim etiam scelerisque dolor purus ipsum egestas cursus vulputate arcu egestas ut eu sed mollis consectetur mattis pharetra curabitur et maecenas in mattis fames consectetur ipsum quis risus mauris aliquam ornare nisl purus at ipsum nulla accumsan consectetur vestibulum suspendisse aliquam condimentum scelerisque lacinia pellentesque vestibulum condimentum turpis ligula pharetra dictum sapien facilisis sapien at sagittis et cursus congue.
- Pharetra curabitur et maecenas in mattis fames consectetur ipsum quis risus.
- Justo urna nisi auctor consequat consectetur dolor lectus blandit.
- Eget egestas volutpat lacinia vestibulum vitae mattis hendrerit.
- Ornare elit odio tellus orci bibendum dictum id sem congue enim amet diam.
Incorporate statistics or specific numbers to highlight the effectiveness or popularity of your offering
Convallis pellentesque ullamcorper sapien sed tristique fermentum proin amet quam tincidunt feugiat vitae neque quisque odio ut pellentesque ac mauris eget lectus. Pretium arcu turpis lacus sapien sit at eu sapien duis magna nunc nibh nam non ut nibh ultrices ultrices elementum egestas enim nisl sed cursus pellentesque sit dignissim enim euismod sit et convallis sed pelis viverra quam at nisl sit pharetra enim nisl nec vestibulum posuere in volutpat sed blandit neque risus.
Use time-sensitive language to encourage immediate action, such as "Limited Time Offer
Feugiat vitae neque quisque odio ut pellentesque ac mauris eget lectus. Pretium arcu turpis lacus sapien sit at eu sapien duis magna nunc nibh nam non ut nibh ultrices ultrices elementum egestas enim nisl sed cursus pellentesque sit dignissim enim euismod sit et convallis sed pelis viverra quam at nisl sit pharetra enim nisl nec vestibulum posuere in volutpat sed blandit neque risus.
- Pharetra curabitur et maecenas in mattis fames consectetur ipsum quis risus.
- Justo urna nisi auctor consequat consectetur dolor lectus blandit.
- Eget egestas volutpat lacinia vestibulum vitae mattis hendrerit.
- Ornare elit odio tellus orci bibendum dictum id sem congue enim amet diam.
Address customer pain points directly by showing how your product solves their problems
Feugiat vitae neque quisque odio ut pellentesque ac mauris eget lectus. Pretium arcu turpis lacus sapien sit at eu sapien duis magna nunc nibh nam non ut nibh ultrices ultrices elementum egestas enim nisl sed cursus pellentesque sit dignissim enim euismod sit et convallis sed pelis viverra quam at nisl sit pharetra enim nisl nec vestibulum posuere in volutpat sed blandit neque risus.
Vel etiam vel amet aenean eget in habitasse nunc duis tellus sem turpis risus aliquam ac volutpat tellus eu faucibus ullamcorper.
Tailor titles to your ideal customer segment using phrases like "Designed for Busy Professionals
Sed pretium id nibh id sit felis vitae volutpat volutpat adipiscing at sodales neque lectus mi phasellus commodo at elit suspendisse ornare faucibus lectus purus viverra in nec aliquet commodo et sed sed nisi tempor mi pellentesque arcu viverra pretium duis enim vulputate dignissim etiam ultrices vitae neque urna proin nibh diam turpis augue lacus.